Chữa đề IELTS writing task 1 dạng pie chart
Pie chart (biểu đồ tròn) là 1 dạng khá quen thuộc trong IELTS writing task 1. Maxlearn hôm nay sẽ gửi đến các bạn một bài chữa đề writing task 1 dạng pie chart nhé.
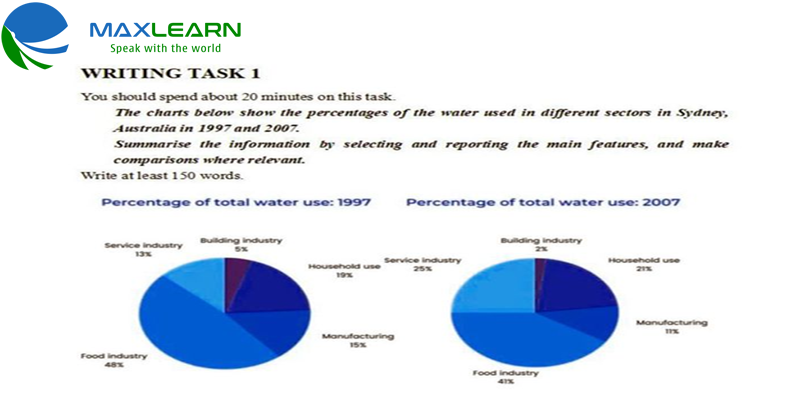
The given graphs give information regarding the rate of water which was consumed in different aspects in Sydney, Australia over the time period from 1997 to 2007.
Overall, food industry was always the sector using the largest amount of water.
In 1997, 48% of the total amount of water was used in food industry, which was followed by a mild drop of 7% in the next decade. Similar patterns were evident in the figure for manufacturing, which accounted 15% in 1997 but later witnessed a slight decrease to 11% in 2007. Regarding industry of construction, this category made up a mere 5% of the total water consumption and after a decade, the statistic showed a modest downward trend of 3%.
By stark contrast, service industry, which stood at 13% in the first year of the examined period, increased twofold with the figure reaching a quarter in 2007. Similarly, a marginal climb was seen in the data for household use from 19% to 21% during the time shown.