Chữa đề Writing task 1 dạng Bar Chart
Hôm nay Trung tâm ngoại ngữ Maxlearn sẽ gửi tới các bạn bài chữa đề IELTS writing task 1 dạng Bar chart nhé.
The charts show the number of people in the UK who ate more than 5 portions of fish and vegetables everyday between 2011 and 2017.
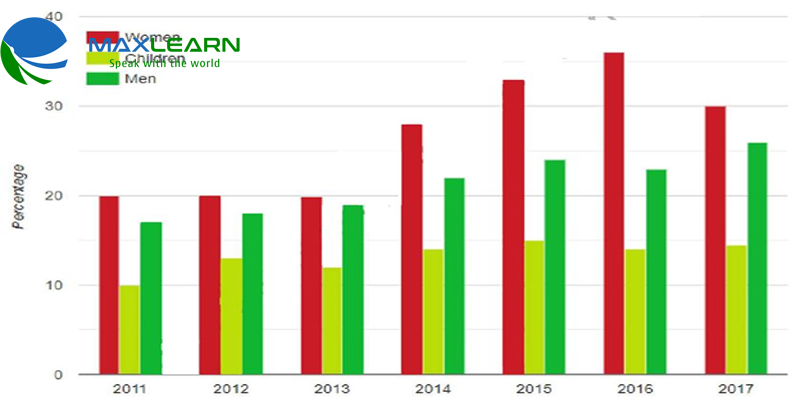
The given bar graph indicated how many people in different categories ate over 5 portions of fish and vegetables each day in the United Kingdom over the time period from 2011 to 2017.
Overall, adults consumed those kinds of food more than children. Moreover, all of the figures witnessed an increase in the consumption of food but with different levels.
At the beginning of the examined period, 20% of female adults ate more than 5 portions of fish and vegetables, which was also higher than the data for male counterparts and children, at 17% and 10% respectively. Women's figure remained static in the next two years before sharping rose to 28% in 2014. Meanwhile, the rate of male adults saw a gradual growth year by year and reached approximately a quarter in 2014. Similarly, children consumed more fish and vegetables however in 2014, its figure which stood at almost 14%, was significantly lower than the remaining categories.
The rate of female residents peaked at 36% in 2016 followed by a notable decline of 6% at the end of the time while male's statistic kept climbing up and ended at 27%. During the rest of the time, children's figure experienced a stabilization.