Giải đề writing task 1 - Cambridge 16 test 1
Hôm nay Trung tâm Ngoại Ngữ Maxlearn xin gửi đến các bạn đang ôn luyện IELTS bài viết chữa đề IELTS WRITING TASK 1 - Cambridge 16 test 1 nhé!
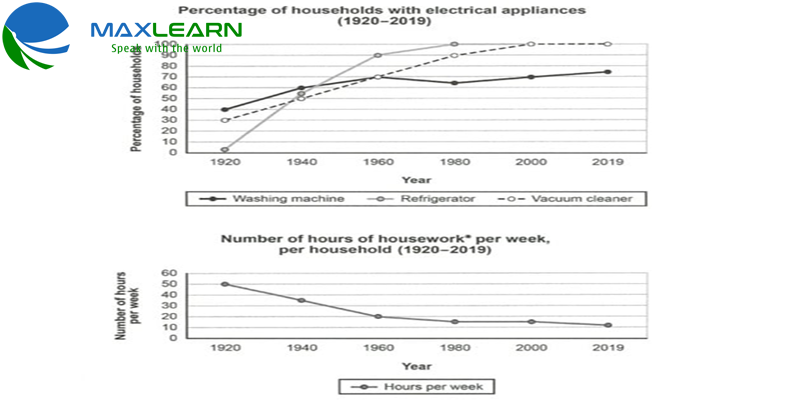
The provided line charts indicate the rate of households having electrical devices and the time they used for housework during the time period from 1920 to 2019.
What stands out from the charts is that each household spent less and less time on housework thanks to the increasing number of electrical appliances they owned throughout the time shown.
In 1920, 40% of households had washing machines, 10% higher than those owning fridges while vacuum cleaners took up a mere 1% this year. However, by 1960, there is a rocket in the vacuum cleaner ownership when its figure reached 90%, higher than the other ones which stood at the same point (70%). Turning number of hours of housework per household, it was 50 hours in 1920, followed by a plunge to 20 hours in 1960.
During the remaining time, all of the figures for three appliances witnessed a rise but with different levels. While vacuum cleaners and fridges become indispensable things in each house, washing machine showed their less popularity with approximately 75% of households buying it. With the support from those appliances, the time for housework of each family during the rest time kept going down and fluctuated around 10 hours.