Giải đề IELTS Writing Task 1 ngày 8/05/2021
Hôm nay Trung tâm Ngoại Ngữ Maxlearn xin gửi đến các bạn đang ôn luyện IELTS bài viết chữa đề IELTS WRITING TASK 1 ngày 8.5.2021 nhé!
The bar chart shows the number of people who visited different museums in London.
Summarise the information by selecting and reporting the main features, and make comparisons where relevant.
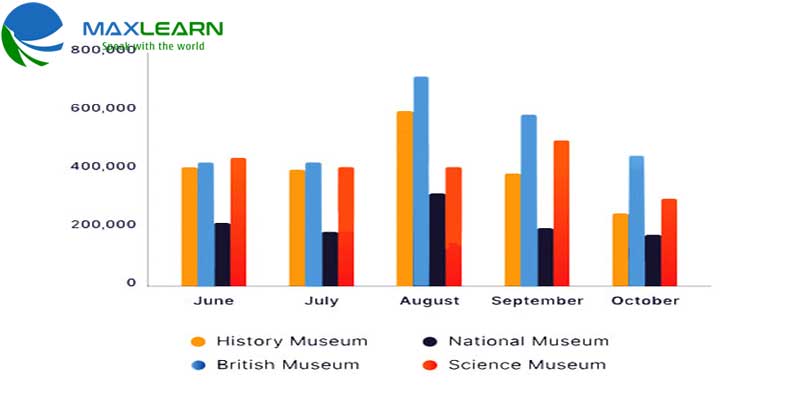
The bar chart indicates how many visitors came to 4 different museums in London over a period of five months from June to October.
Overall, all of the museums witnessed wild fluctuations in the number of travelers. Moreover, British museum seemed to be the most favored touring destination.
In the first two months of the period, all figures remained nearly constant with the quantities of people coming to History museum, British museum and Science museum standing at over 400,00 while the data for National Museum was significantly lower, at around 200,000. In August, British museum attracted the highest number of travelers, at roughly 710,000, followed by the figure for History museum being exactly 600,000. While the figures for science museum were the same in July and August, National museum observed a dramatic growth to well higher 300,000 in August.
The numbers of visitors to History and British museums declined notably month by month later while the data for science museum witnessed a slight rise to 500,000 in September before going down to 300,000 in the last month. Finally, National museum's visitor number was relatively static at around 20,000 during the remaining months.