Bài chữa Writing task 1 dạng Bar chart
Hôm nay Trung tâm ngoại ngữ Maxlearn xin gửi đến các bạn bài chữa Writing task 1 dạng Bar chart nhé!
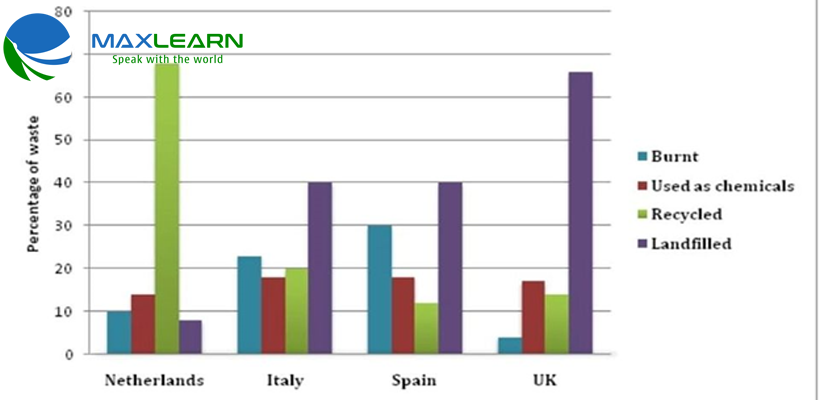
The bar chart shows European countries dealing with the waste in their cities.
A glance at the given/ provided bar chart depicts some striking information about four nations in Europe which use four different methods to deal with the rubbish in their cities.
It is evident from the information supplied that recycling litter is the most popular one in Netherlands while sending rubbish into landfill is the most favored/chosen in the remaining countries.
The percentage of waste (which is) burnt in Spain stands at the highest point( 30%) while the data of UK is ten times less than. Approximately 22% of waste is burnt in Italy, compared to just 10% waste burnt in Netherlands. The rates of rubbish used as chemicals in four European nations are fairly similar. In more details, the figures for Italy and Spain are relatively equal/ same at about 18% whereas the proportions of litter used as chemicals in Netherlands and UK observe a mild difference/ gap of 1%.
Regarding recycling, in Netherlands it is the most favored method of handling waste with over 65% while the figures of Italy, Spain and UK are 20%, 11% and nearly 13%, respectively. The least popular approach/way of waste disposal in Netherlands is sending rubbish into landfill, accounting for under 10%. By stark contrast, the data for UK is significantly higher than the data of three remaining countries. Almost 65% of litter in this country is sent into landfills, whereas the figures of Italy and Spain stand at the same points ( 40%).