Chữa đề IELTS Writing task 1 dạng line
Hôm nay, Maxlearn xin gửi đến các bạn bài chữa đề IELTS Writing task 1 dạng line- một dạng đề rất hay gặp trong bài thi IELTS writing task 1.
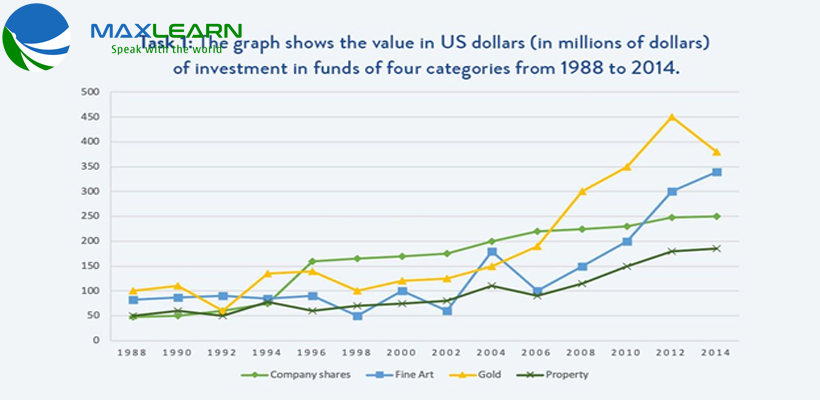
The line chart describes the investment in funds of four areas over the time period between 1988 and 2014.
It is clearly seen that all of the figures witnessed an increase with different levels.
In 1988, gold received the highest level of investment at 100 million dollars while the amount of money invested in fine art was slightly lower. In the next 4 years, the data for gold bottomed out at over 50 million dollars while the statistics for fine art saw a period of stabilization until 1996. A gradual growth in the investment in gold was seen during the following two decades and it peaked at exactly 450 million dollars in 2012 before declining to 375 million dollars in 2014. Meanwhile, from 1996 to 2006,the figure for fine art fluctuated but after 2006, it wen up year by year and reached the highest point of 350 million dollars, which was ranked the second position.
Turning to the investment in company shares and property, the data witnessed the same levels at around 50 million dollars between 1988 to 1994. The amount of money invested in company shares grew notably to 150 million dollars in 1996 while the the reverse could be seen in the figure for property which reduced to merely 50 million dollars. In the period of 18 years from 1996 to 2014, the data for company shares and property saw a gradual upward trend to 200 million dollars and 175 million dollars respectively with the gap between those remaining constant at 100 million dollars.