Giải đề thi chính thức IELTS Task 1 ngày 10/04/2020
Hôm nay Maxlearn sẽ gửi đến các bạn bài viết chữa đề thi IELTS Writing task 1 ngày 10/04/2020 nhé.
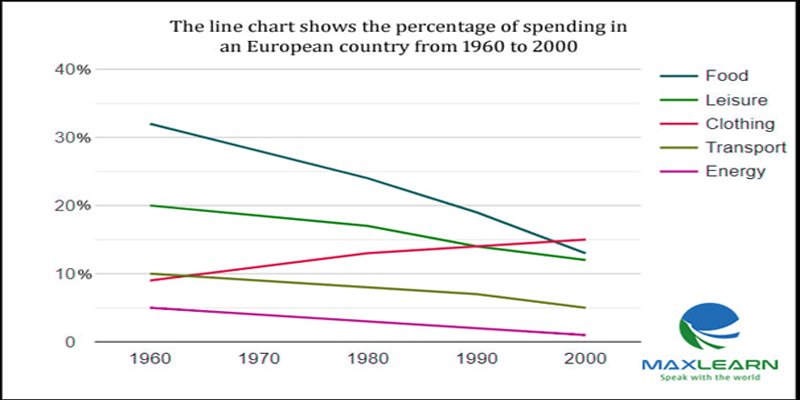
The given line graph indicates the rate of expenditure in a country in Europe during the time between 1960 and 2000.
Overall, almost every category witnessed a downward trend in the spending except clothing.
Standing at the highest point (32%) in 1960, the spending on food declined gradually year by year and at the end of the period, the figure concluded at approximately 14%. The rate of money spent on leisure ranked the second at 20% in 1960 before going down steadily until 1980. The remaining time observed a notable drop in the data and it ended at 13% in 2000.
The gap between the figures for transport and energy was 5% in 1960. Throughout the time show, both of them experienced a stable decrease and seemed to keep the same level of difference with the spending on transport and energy being 5% and 1%, respectively. In contrast, only the data for clothing rose with the initial point being under 10% in 1960 which surpassed food in 1998 to become the section spent the most, at 15%.