Chữa đề thi IELTS Writing task 1 ngày 18/7/2020
Hôm nay, Trung tâm ngoại ngữ Maxlearn chữa đề thi IELTS Writing task 1 ngày 18/7/2020 xin gửi đến các bạn luyện thi IELTS
IELTS Writing task 1:
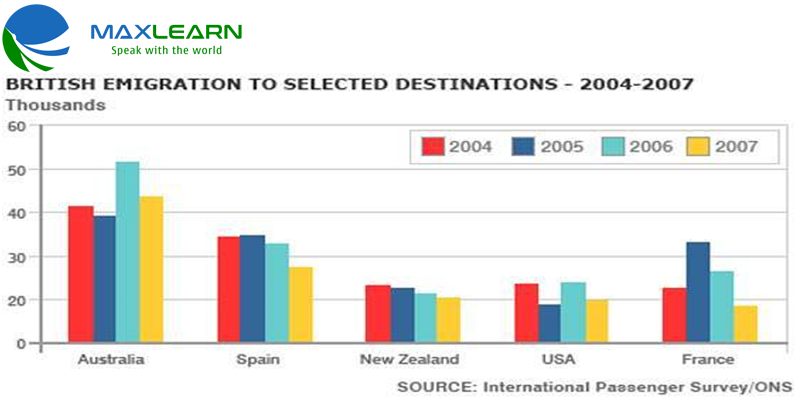
The chart shows British emigration to selected destinations between 2004 and 2007.
Summarize the information by selecting and reporting the main features and make comparisons where relevant.
========================================
The bar graph depicts the number of emigrants from Britain to five different areas in the world over the four-year period from 2004 to 2007.
Overall, Australia was the most selected destination during the entire time.
In 2004, over 40 thousand British people immigrated to Australia, double the figure for those coming to France. While the data for Australia declined slightly, that for France surged with a rise to roughly 33 thousand people in the next year. However, one year later, both the figures continued witnessing the opposite trends with a noticeable growth to more than 50 thousand in the number of emigrants to Australia and a remarkable decline to 25 thousand in the data for France. In 2007, Australia had 43 thousand British people registering to become its citizens, significantly higher than the statistic for France.
Turning to Spain, the figure remained constant at 35 thousand people in the first couple of years but marginally fell in the next years. At the same time, the British immigrant number in New Zealand, which started at 23 thousand people in 2004, experienced a gradual deceleration and concluded at 20 thousand people. Finally, USA had the number fluctuating from 20 to 25 thousand during the time.